EBSD analyses of metallic, ceramic, semiconductor and geological specimens in a table top Hitachi TM 4000 Plus SEM
EBSD table top SEM
Summary:
- By Jarle Hjelen, Wilhelm Dall, Håkon Wiik Ånes, Sasha Vuckovic, Torbjørn Sunde, Kurt Aasly.
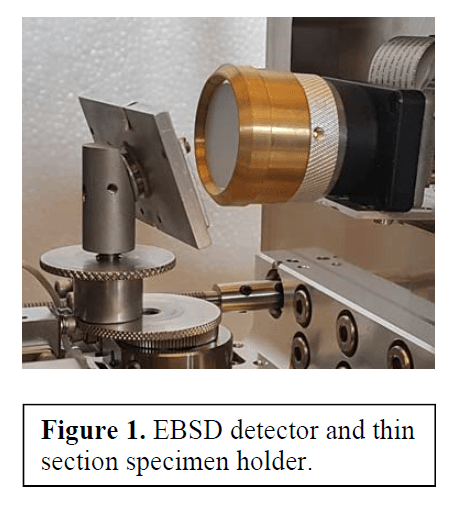
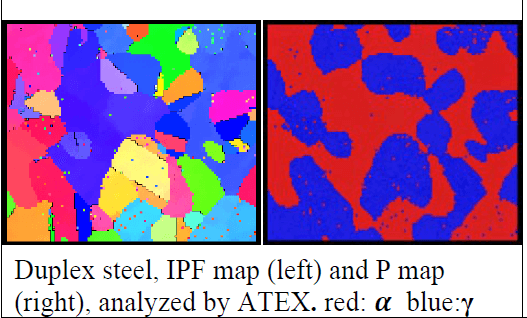
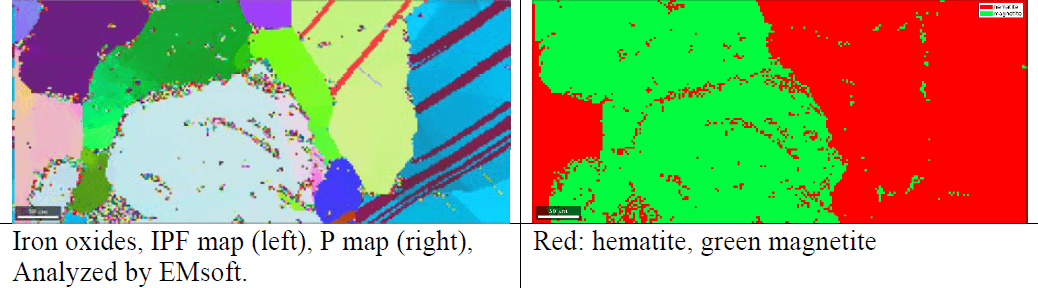
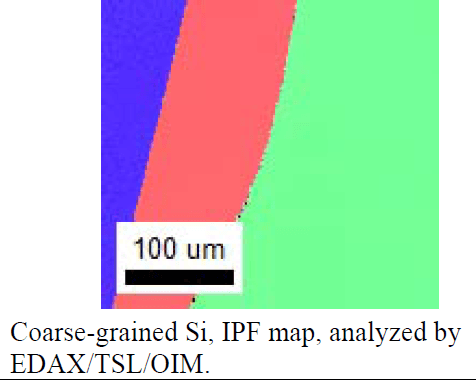
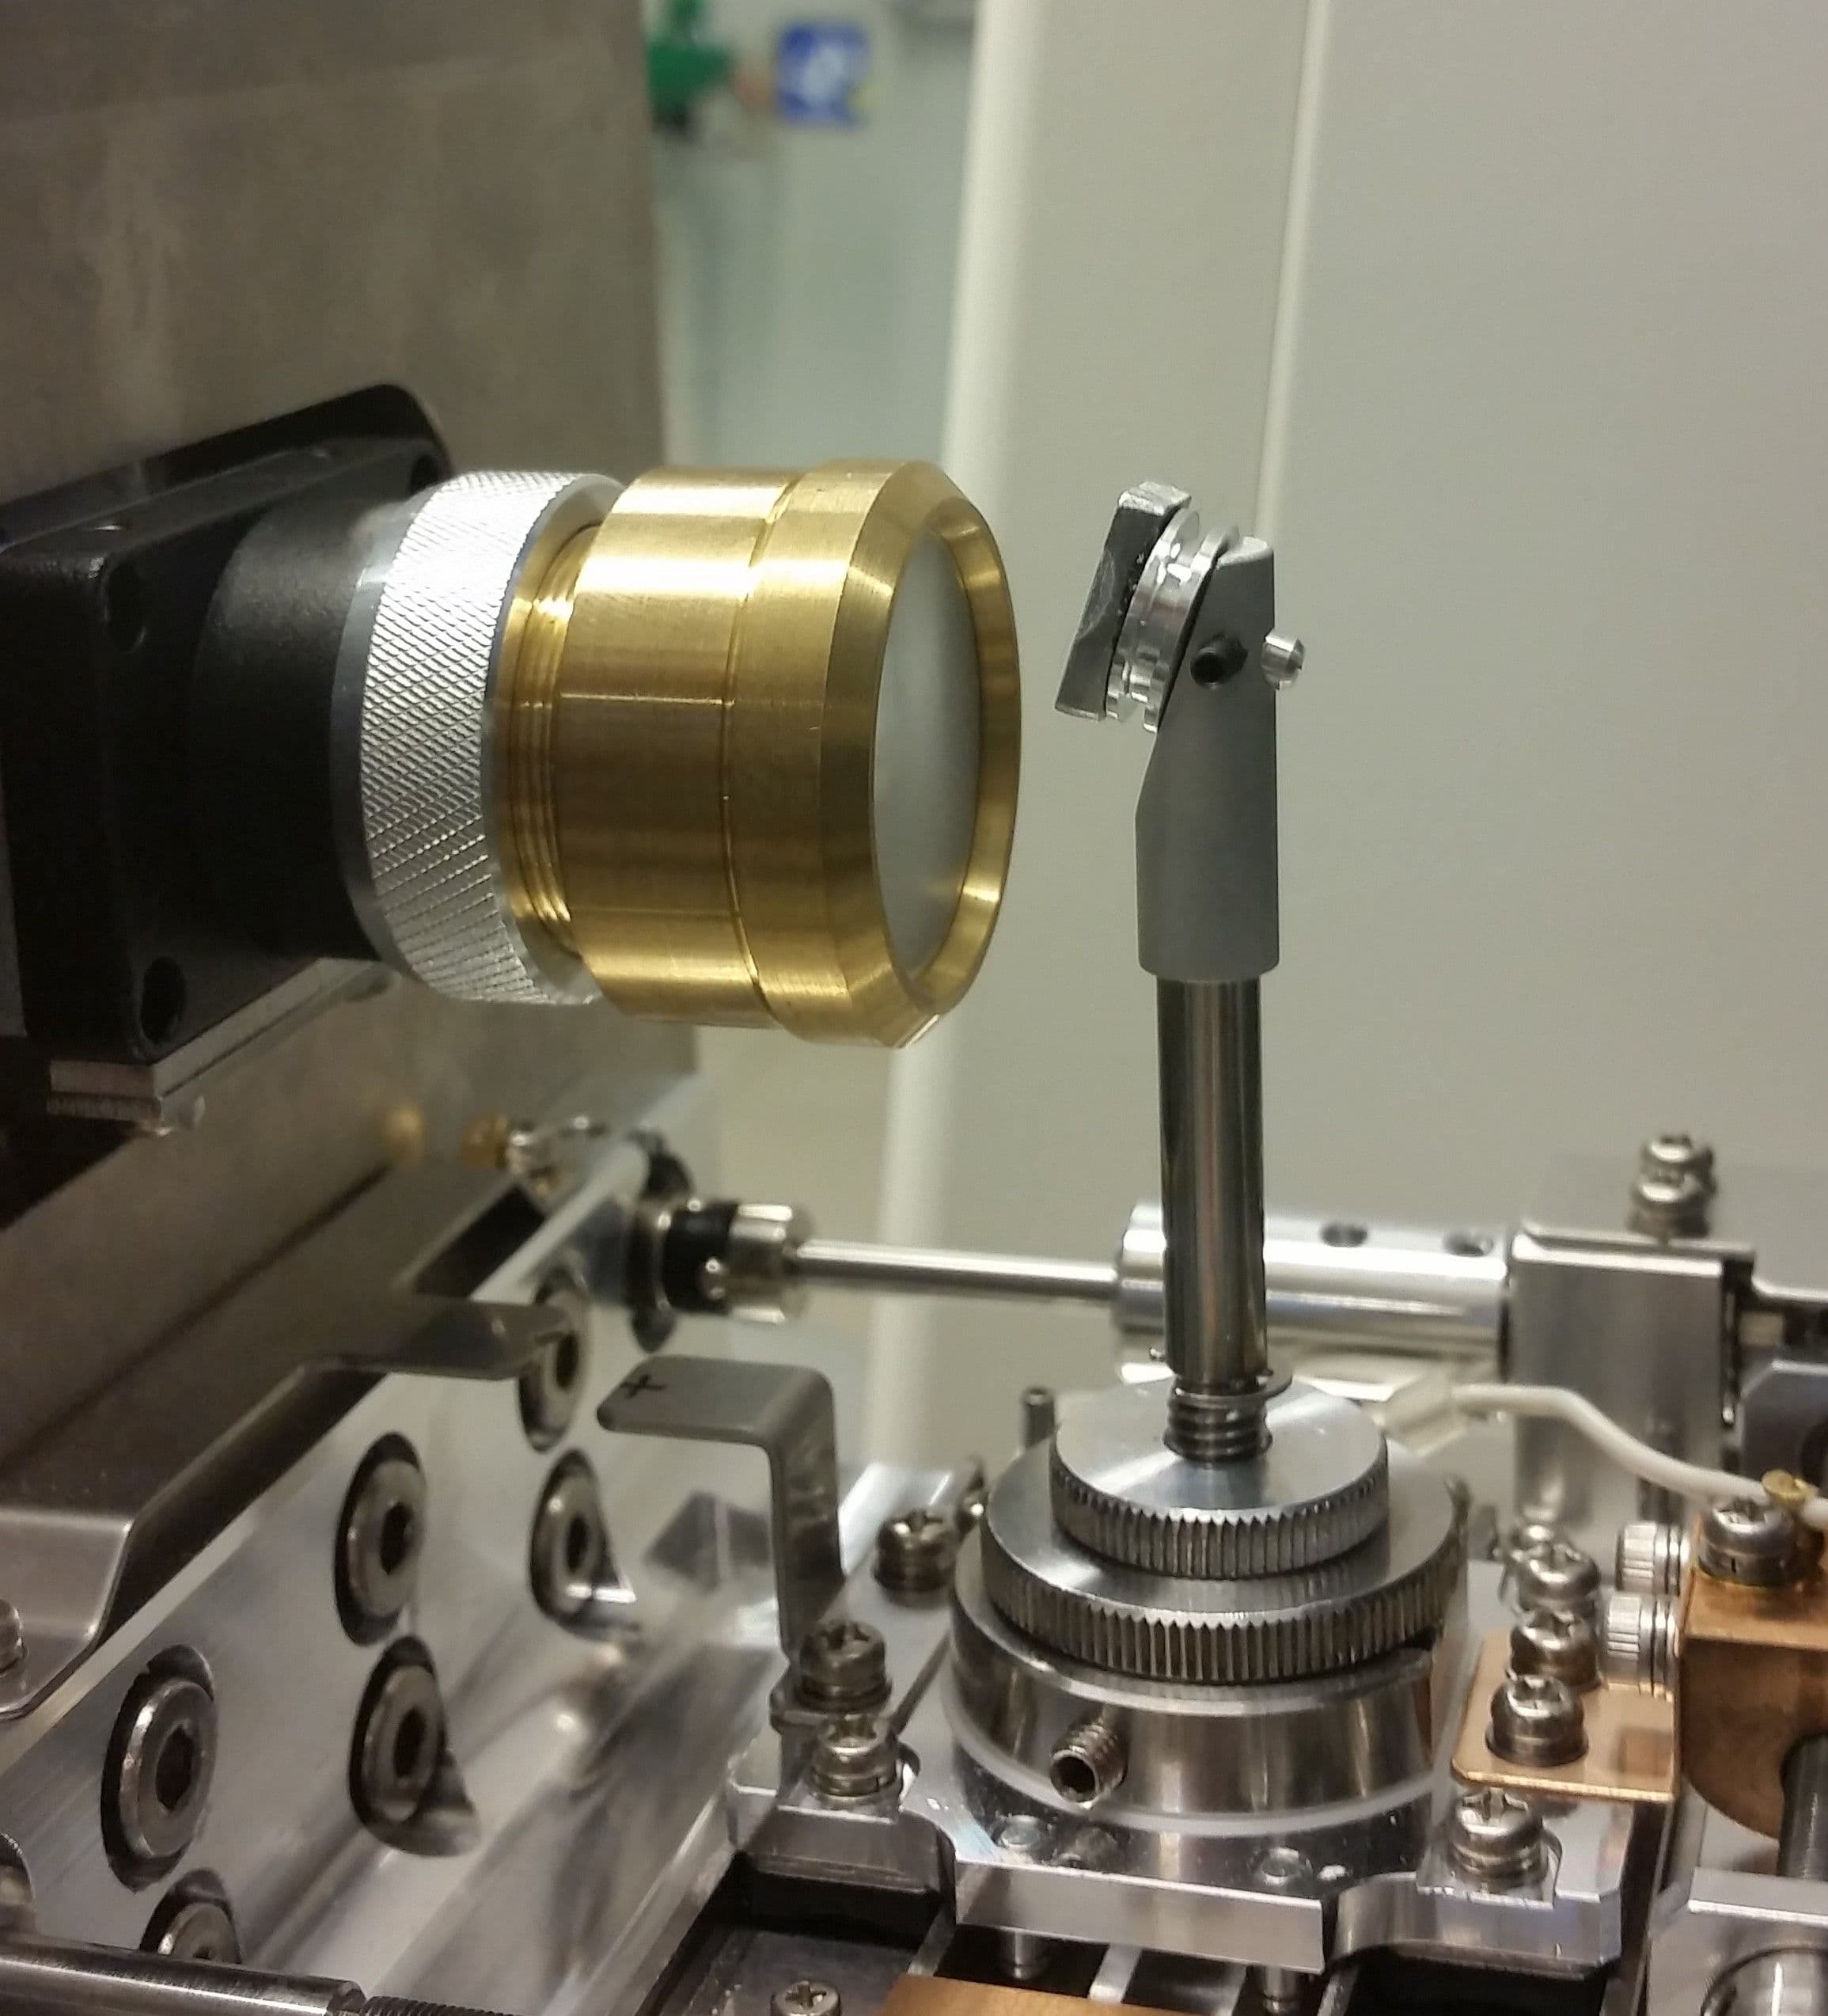
- A variety of specimen types was characterized by EBSD in a table top SEM. Metallic specimen (duplex stainless steel), a ceramic (alumina) specimen, part of a large grain silicon wafer and a geological specimen (iron oxides) were investigated. The EBSPs were acquired with a compact NORDIF NICE detector and streamed to the HDD on a lap top PC by use ofN3 EBSD acquisition software. The specimens were mounted on a 70° pre-tilted specimen holder.
Details:
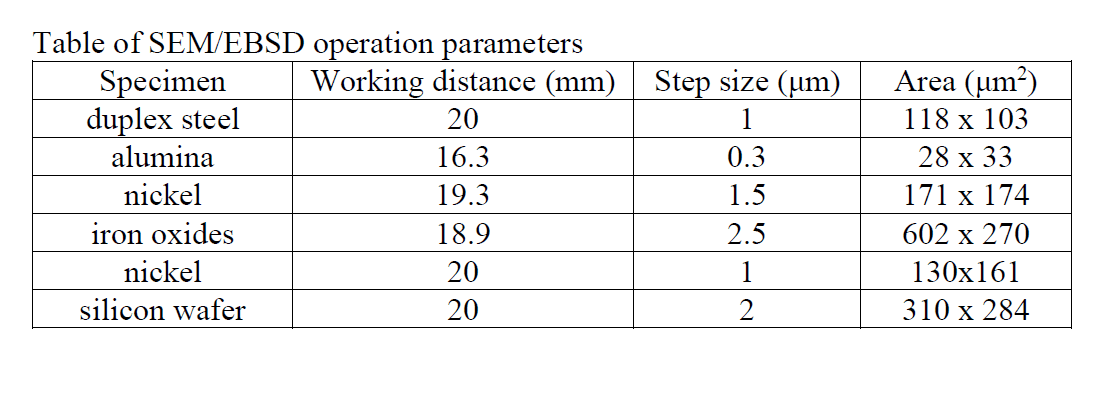
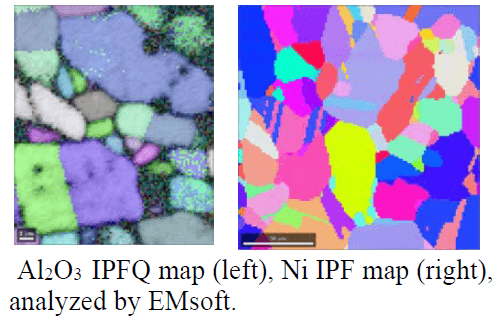
The accelerating voltage was 15kV, working distance about 18 +/-2 mm. All specimens were analyzed in low vacuum mode. The pattern resolution was 96 x 96 pixels. To improve signal to noise ratio on-line averaging was applied. In the Table step size and the analysed area for all specimens are listed. The EBSPs were indexed off-line by EBSD software: EDAX/TSL (OIM), EMsoft and ATEX. Inverse Pole Figure (IPF) - and IPF+Quality (IPFQ) maps are shown.